
Introduction to Risk Profiles
A risk profile provides the composite view of risks related to a specific strategy or business objective at a particular level of the entity (e.g., overall entity level, business unit level, functional level) or aspect of the business model (e.g., product, service, geography). These risk profiles bring together several important considerations in enterprise risk management, namely performance targets, the assessment of the overall amount of risk for varying levels of performance, risk appetite, and tolerance. Risk profiles are used to help organizations evaluate alternative strategies and support the process of identifying and assessing risks.
This relationship between risk and performance is rarely constant. Changes in performance do not always result in corresponding changes in risk, and therefore a single-point illustration used in many typical enterprise risk management approaches is not always helpful. A more complete illustration shows the aggregate amount of risk associated with different levels of performance, where risk is shown as a continuum of potential outcomes. The organization balances the amount of risk with desired performance along this continuum.
This appendix offers examples of how risk profiles may be developed and applied to support the organization in applying the principles of the Framework.
Developing Risk Profiles
When developing a risk profile, the organization must understand the:
⦁ Strategy or relevant business objective.
⦁ Performance target and acceptable variances in performance.
⦁ Risk capacity and appetite for the entity.
⦁ The severity of the risk to the achievement of the strategy and business objective.
The risk profile, as depicted in this appendix, enables the organization to evaluate:
⦁ The relationship between risk and performance, noting that the amount of risk for a given strategy or business objective is typically not static and will change for different levels of performance.
⦁ Assumptions underlying the risk assessment for a given strategy or business objective.
⦁ The level of confidence with which the assessment has been performed and the potential for unknown risks.
⦁ Where corrective actions may be required in setting strategy, business objectives, performance targets, or risk responses.
To develop a risk profile, the organization determines the relationship between the level of performance for a strategy or business objective and the expected amount of risk. On a risk graph, performance is plotted along the x-axis and risk is along the y-axis (Figure D.1). The resulting line is often referred to as a “risk curve” or “risk profile.”

Each data point is plotted by considering the perceived amount of risk that corresponds to the achievement of a business objective or strategy. As performance changes, the organization identifies how the amount of risk may change. The risk may change due to the changes in execution and business context.
Both quantitative and qualitative approaches can be used to plot points. If the organization has sufficient data on a strategy or business objective, it may use a quantitative approach, such as probabilistic modeling or regression analysis. Where data is not available or where business objectives are less important, the organization may prefer to use a qualitative approach, such as performing interviews, facilitating workshops, or benchmarking.
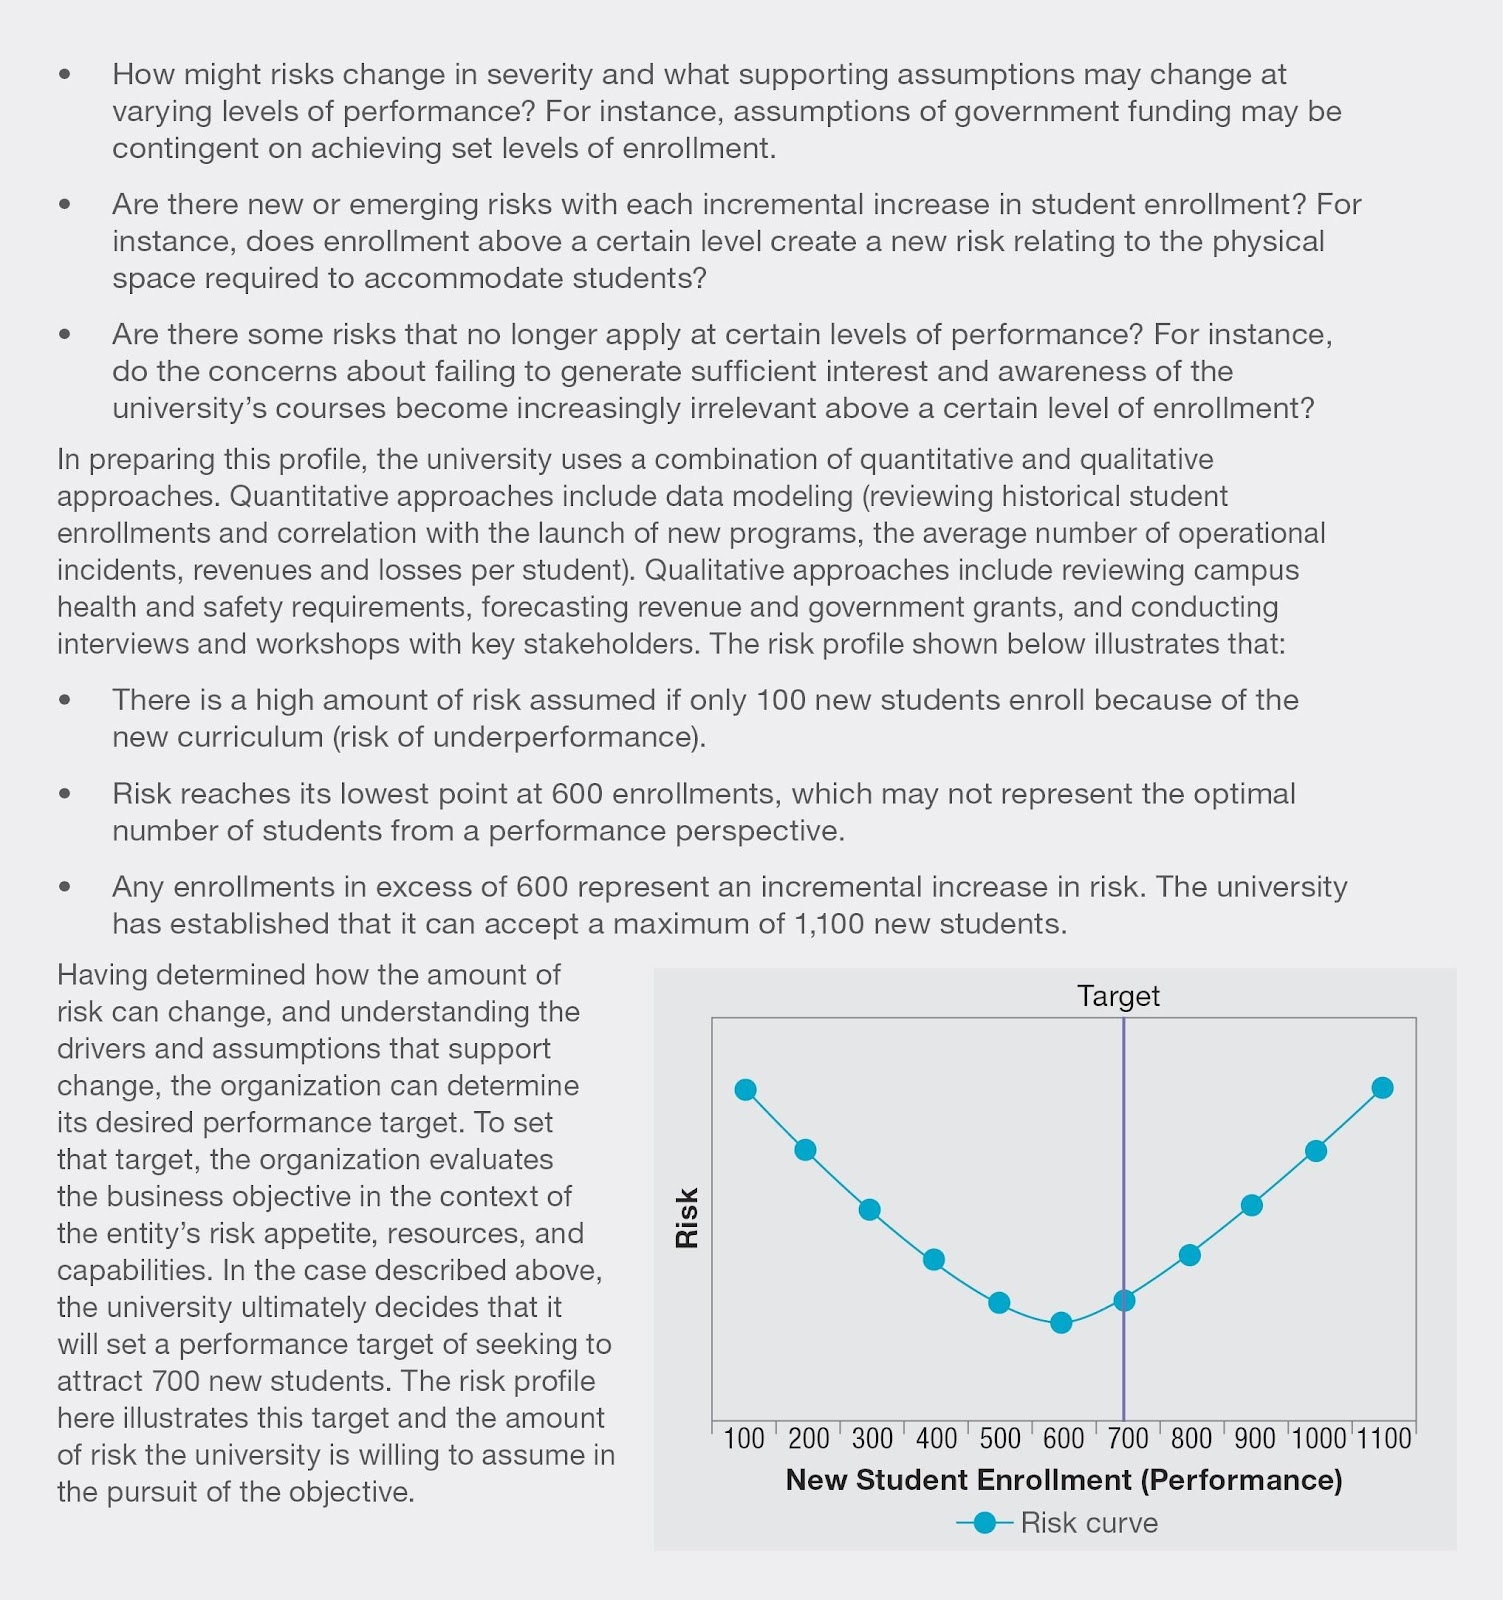
Example D.1 describes how one entity plotted its risk profile.

Risk, Strategy, and Objective-Setting Incorporating Risk Appetite
Using a risk profile, the organization can outline its risk appetite in relation to a proposed strategy or business objective. In Figure D.2, the risk appetite is plotted as a horizontal line parallel to the x-axis (performance). The gradient of the line indicates that the risk appetite remains constant for all levels of performance at a given point in time. The y-axis (risk) uses the same metric or expression of risk appetite as is referred to in an entity’s risk appetite statement. For example, the y-axis may be earnings at risk, value at risk, or other metrics.

The section of the curve from the point of intersection (Point A) where it continues above the risk appetite line indicates a level of performance that exceeds the entity’s appetite and where risk becomes disruptive to the entity.
Organizations may also want to incorporate an additional parallel line above risk appetite to indicate risk capacity, shown in Figure D.3.

Using Risk Profiles to Consider Alternative Strategies
Organizations can develop profiles of potential risks as part of considering alternative strategies. For each strategy, an organization may prepare a risk profile that reflects the expected types and amount of risks. These risk profiles support the strategy selection process by highlighting differences in the expected risk for different strategies.
Figure D.4 illustrates how profiles can be compared. Alternative A shows a flatter curve, indicating that the entity faces less incremental risk as to performance increases. That is, the intersection of the risk curve and risk appetite is farther to the right, indicating a greater opportunity for performance before the entity exceeds appetite. Established entities operating in mature, stable markets or with stakeholders who expect lower risk profiles may seek strategies that resemble Alternative A.

Conversely, risk-taking entities such as start-ups or venture capitalists may explore strategies that are more typical of Alternative B. In this case, an entity would seek more aggressive performance in return for assuming greater risk.
Quantitative and qualitative techniques are used to develop the profile of potential risks and maybe the same tools that are then used to support risk identification and assessment processes. This includes quantitative analysis and modeling where there is sufficient data. Where data is not available, more qualitative techniques may be employed.
Considering Risk in Establishing Business Objectives and Setting Performance Targets
Once an organization selects a strategy, it carries out a similar analysis to establish business objectives. Organizations that are faced with alternative objectives seek to understand the shape and height of a curve for a potential business objective.
First, the organization sets a performance target for its business objectives. The performance target is determined in relation to the risk appetite and selected strategy. On a risk profile, the target demonstrates the desired performance and corresponding amount of risk (see Figure D.5).

Further, it illustrates the distance between the accepted amount of risk and risk appetite. The more aggressive the entity, the less will be the distance between the intersection of the performance target and the risk curve (Point A), and the intersection of performance target and risk appetite (Point B).
Using Risk Profiles to Demonstrate Acceptable Variation in Performance
The organization next determines the acceptable variation in performance on both sides of the target. This is illustrated in the figures by the dotted lines that run parallel to the performance target. The trailing and exceeding variances are set to reflect the risk appetite of the entity. There is no requirement that they are equidistant from the performance target. The closer the variances are set to the performance target, the less appetite for risk. However, by setting variations close to the performance, management considers the tradeoffs in the additional resources required to manage variability.
Identifying Risks in Performance
Organizations identify and assess the risks to business objectives and chosen strategies. Any potential risks that have been identified as part of the selection process provide a starting point for identifying and assessing risks in execution. This process yields a risk profile of actual risks for each business objective and overall strategy—one that either confirms the expected risks or one that indicates additional risks.
Additional risks may be identified for a number of reasons. The organization may have completed a more rigorous analysis after selecting a business objective, or may have gained access to more information, giving it more confidence in its understanding of the risk profile, or may have determined it needs to update the list of expected risks due to changes in the business context has occurred.
The outputs of the risk identification process, the risk universe, form the basis on which an organization is able to construct a more reliable risk profile.
Using Risk Profiles when Assessing Risk
Risks identified and included in a risk profile are assessed in order to understand their severity to the achievement of an entity’s strategy or business objectives. Management’s assessment of risk severity can focus on different points of the risk profile for different purposes:
- To confirm that performance is within the acceptable variation in performance.
- To confirm that risk is within risk appetite.
- To compare the severity of a risk at various points of the curve.
- To assess the disruption point in the curve at which the amount of risk has greatly exceeded the appetite of the entity and impacts its performance or the achievement of its strategy or business objectives.
The risk profile in Figure D.6 depicts the amount of risk within an assumed time horizon. To incorporate time into the risk profile, management must define the performance target with reference to a time period.

In assessing the distance of the curve from the x-axis, management considers the aggregate amount of known (existing, emerging, and new risks) and unknown risks. The amount of unknown risk may be estimated with varying levels of confidence depending on the type of business objective, experience and knowledge of the organization, and available data. Where the number and amount of unknown risks is potentially large (e.g., developing new technology), the distance between the risk curve and the x-axis will typically be greater to indicate greater risk. For business objectives in more mature environments with significant performance data, knowledge, and experience, the amount of unknown risk may be considered much less significant, and the distance between the risk curve and the x-axis will therefore be smaller. The distance of the curve from the x-axis also demonstrates how multiple risks impact the same business objective.
The organization may choose to use different assessment methods for different points of the risk curve. When focused on the acceptable variation in performance, analysis of risk data may be a suitable approach. When looking at the extreme sections of the curve, scenario analysis workshops may prove more effective in determining the height and shape of the curve.
As with considering alternative strategies and identifying risks, management uses quantitative and qualitative approaches, or a combination of both, to assess risks and develop a risk profile. Qualitative assessment is useful when risks do not lend themselves to quantification or when it is neither practicable nor cost-effective to obtain sufficient data for quantification. For example, consider a reputable technology company that is contemplating launching a new product that is currently not commercially available. In developing a risk profile of the risk of launching the R&D of the new product, management relies on its own business knowledge and its engineers’ expertise to determine the height and shape of the curve.
For risks that are more easily quantifiable, or where greater granularity or precision is required, a probability modeling approach is appropriate (e.g., calculating value at risk or cash flows at risk). For example, when the same technology company assesses the risk of maintaining operations in a foreign country, it employs modeling when plotting the curve to identify sufficient points outlining the severity of its foreign exchange exposure.
Using Risk Profiles when Prioritizing Risks
How organizations prioritize risks can affect the risk profile for a strategy or business objective. The following are examples of how the prioritization criteria (see Principle 14) are incorporated into the risk profile:
- Adaptability influences the height and shape of the risk curve reflecting the relative ease with which the organization can change and move along the curve.
- Complexity of a risk will typically shift the risk curve upwards to reflect greater risk.
- Velocity may affect the distance at which acceptable variation in performance is set from the target. (Note that the velocity of the risk also reflects the third dimension of time, and therefore is not
reflected in the risk curve.)
- Persistence, not shown on the risk curve as it relates to a third dimension, may be reflected in a narrowing of the acceptable variation in performance as the entity acknowledges the sustained effect on performance.
- Recovery, the time taken to return to acceptable variation in performance, is considered part of persistence. How the entity recovers will shape the risk curve outside of the acceptable variation in performance and the relative ease with which the entity can move along the curve.
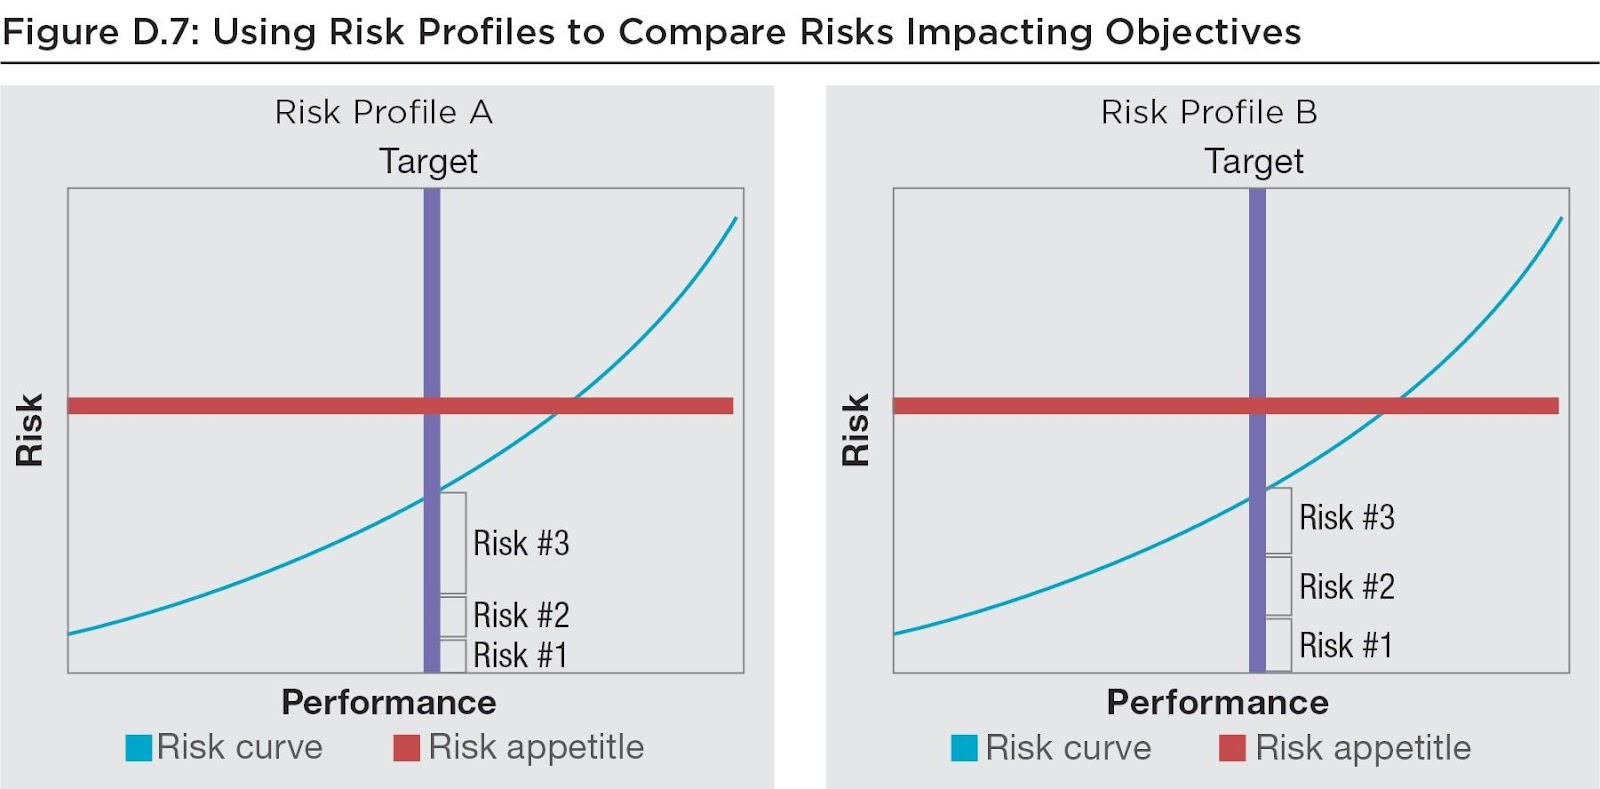
Many organizations choose to use severity as a prioritization criterion. For example, consider the risk profiles in Figure D.7. If an organization was asked to prioritize the risks in Risk Profile A compared to those in Risk Profile B, it may well select Risk #3 in Profile A as the most important because of its absolute severity (a risk-centric perspective). But if the organization were to view Risk Profile A from a business objective perspective, it would seem that the entity is still well within its risk appetite for the particular performance target. In fact, both Risk Profile A and B have the same severity of risk for their respective performance targets. Consequently, the severity of one risk (e.g., Risk #3 in Risk Profile A) should not be the sole basis for prioritization relative to other risks.
Using Risk Profiles when Considering Risk Responses
Once the organization develops a risk profile, it can determine if additional risk responses are required. The height and shape of the risk curve can be impacted depending on the risk response chosen (see Principle 15):
- Accept: No further action is taken to affect the severity of the risk and the risk profile remains the same. This response is appropriate when the performance of the entity and corresponding risk are below the risk appetite line and within the lines indicating acceptable variation in performance.
- Avoid: Action is taken to remove the risk, which may mean ceasing a product line, declining to expand to a new geographical market, or selling a division. Choosing avoidance suggests that the organization is not able to identify a response that would reduce the impact of the risk to an acceptable severity. Removing a risk will typically shift the curve downwards and/or to the left with the intent of having the target performance to the left of the intersection of the risk curve and the risk appetite.
- Pursue: Action is taken that accepts increased risk to achieve increased performance. This may involve adopting more aggressive growth strategies, expanding operations, or developing new products and services. When choosing to exploit risk, management understands the nature and extent of any changes required to achieve desired performance while not exceeding the target residual risk. Here the risk curve may not change but the target may be set higher, and therefore setting the target at a different point along the risk curve.
- Reduce: Action is taken to reduce the severity of the risk. This involves any of myriad everyday business decisions that reduce residual risk to the target residual risk profile and risk appetite. The intent of the risk response is to change the height and shape of the curve, or applicable sections of the curve, to remain within the risk appetite set for the entity. Alternatively, for risks that are already within the risk appetite, the reduce response may pertain to the reduction in variability of performance through the deployment of additional resources. The effective reduction of a risk would see a flattening of the risk curve for the sections impacted by the risk response.
- Share: Action is taken to reduce the severity of a risk by transferring or otherwise sharing a portion of the risk. Common techniques include outsourcing to specialist service providers, purchasing insurance products, and engaging in hedging transactions. As with the reduce response, sharing risk lowers residual risk in alignment with risk appetite. A section of the risk curve may change, although the entire risk curve likely shares similarities to one where risk has not been shared.
- Review business objective: The organization chooses to review and potentially revise the business objective given the severity of identified risks and acceptable variation in performance. This may occur when the other categories of risk responses do not represent desired courses of action for the entity.
- Review strategy: The organization chooses to review and potentially revise the strategy given the severity of identified risks and risk appetite of the entity. Similar to reviewing business objectives, this may occur when other categories of risk responses do not represent desired courses of action for the entity. Revisions to a strategy, or adoption of a new strategy, also require that a new risk profile be developed.
Figure D.8 shows how a risk profile changed after carrying out a risk response, such as entering into an insurance arrangement. For example, fruit farmers may purchase weather-related insurance for floods or storms that would result in their production levels dropping below a certain minimum. The risk curve for production levels flattens for the outcomes covered by insurance.

Developing a Portfolio View
After selecting risk responses, management develops a composite view of residual risk (i.e., post-assessment and implementation of risk response). This composite view forms an entity-wide portfolio view of the risk that the entity faces.
While the portfolio view represents the view of risk at that level, management may choose to depict that view through a variety of lenses. Figures D.9 and D.10 illustrate two alternatives for viewing risk profiles. The first, Figure D.9, illustrates a risk profile linked to strategy and entity objectives. The second, Figure D.10, illustrates the risk profile relating to the portfolio view of entity-level objectives.
An organization may choose how to depict the portfolio depending on how performance is articulated and who is concerned. For instance, a chief financial officer may focus on a view that depicts the severity of risk in relation to financial performance. A chief operating officer may focus on a view that depicts the severity of risk in relation to operational performance. And the chief human resources officer may focus on a view that depicts the severity of risk in relation to culture and resource allocation. Yet, each of these views is based on one shared understanding of risk to business objectives.
Through the portfolio view, the organization identifies severe entity-level risks. Figure D.9 illustrates the portfolio view.
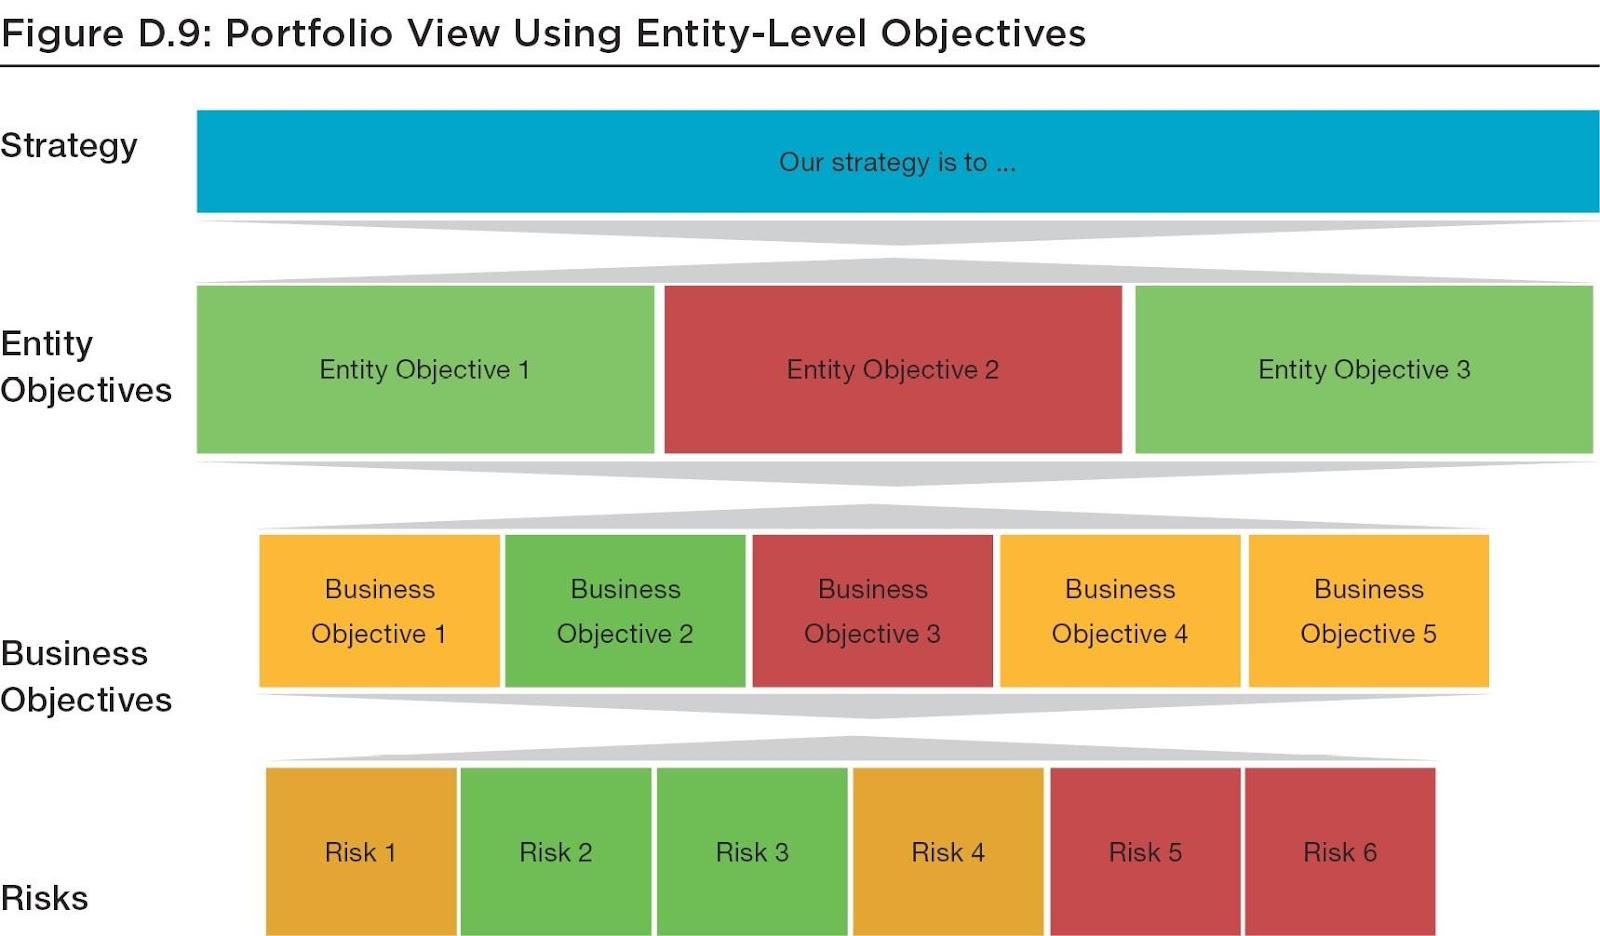
When preparing a portfolio view, the organization may also choose to develop a risk profile that provides added context to the portfolio view. Figure D.10 illustrates the risk profile of two entity-level objectives. The first graph illustrates how risk to the achievement of entity objective 1 (at the current level of performance) is within both risk appetite and risk capacity (and shown as green in Figure D.9). The second graph illustrates how risk to the achievement of entity objective 2 is above the risk appetite, although still within risk capacity (red in Figure D.9). These two perspectives are reflected above in Figure D.9.

An organization will typically use both qualitative and quantitative techniques in developing this view. Qualitative techniques include scenario analysis and benchmarking. Quantitative techniques include regression modeling and other means of statistical analysis to determine the sensitivity of the portfolio to sudden or large changes. These changes may be represented as shifts in the risk curve or gradient.
Analysis may also identify the point on the curve where change becomes a disruption to the performance of the entity. For example, using entity objective 1, an organization identifies that a drop of more than 25% in a specific index represents a disruptive change where the entity exceeds its risk appetite and affects the achievement of the strategy. This is represented at the point where the gradient of the curve steepens significantly (Point A). Further, the organization determines that a 50% drop would affect performance to the extent that the entity exceeds its risk capacity and threatens the viability of the entity. This is represented where the risk curve intersects the risk capacity line (Point B).
By using stress testing, scenario analysis, or other analytical exercises, an organization can avoid or more effectively respond to big surprises and losses. By analyzing the effect of hypothetical changes on the portfolio view, the organization identifies potential new, emerging, or changing risks and evaluates the adequacy of existing risk responses. The purpose of these exercises is for management to be able to assess the adaptive capacity of the entity. They also help management challenge the assumptions underpinning the selection of the entity’s strategy and assessment of the risk profile.
Monitoring Risk Management Performance
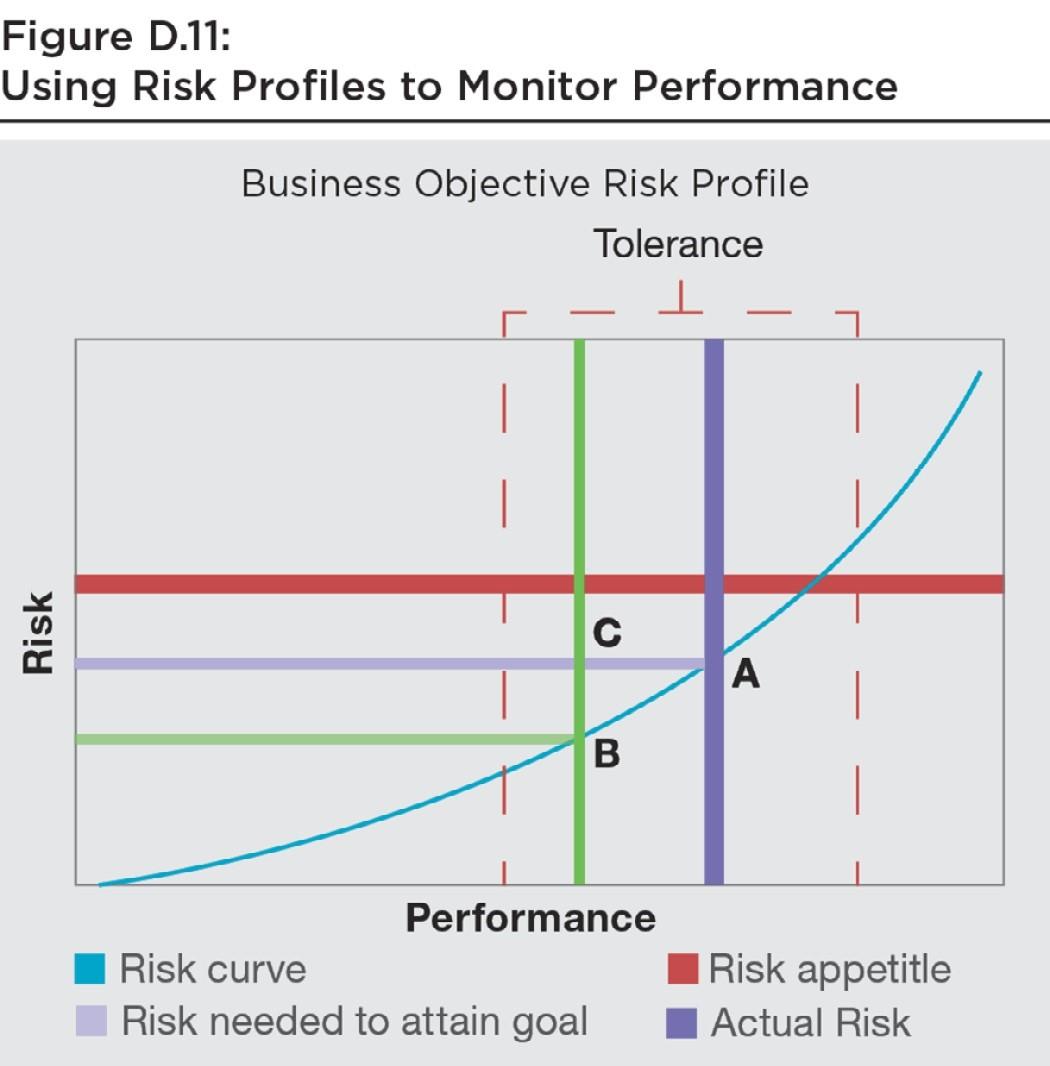
Organizations can use graphical representations to understand how risk is impacting performance. As shown in Figure D.11, management analyzes the risk profile to determine whether the current level of performance risk is greater, less than, or as expected compared to the risk assessment results. Additionally, management considers whether a change in performance has created new factors that influence the shape of the curve. Based on this analysis, management can take corrective action.
- Has the organization performed as expected and achieved its target? Using a risk profile, the organization reviews the performance set and determines whether targets were achieved or if variances occurred. Point B on the figure shows an organization that has not met its planned performance (Point A) but remains within acceptable variation.
- What risks are occurring that may be impacting performance? In reviewing performance, the organization observes which risks have occurred or are presently occurring. Monitoring also confirms whether risks were previously identified or whether new, emerging risks have occurred. That is, are the risks that were identified and assessed and that inform the shape and height of the risk curve consistent with what is being observed in practice?
- Was the entity taking enough risk to attain its target? Where an entity has failed to meet its target, the organization seeks to understand whether risks have occurred that are impacting the achievement of the target or whether insufficient risk was taken to support the achievement of the target. Given the actual performance of the entity in the figure, Point B also indicates that more risk could have been taken to attain its target.
- Was the estimate of risk accurate? In those instances where the risk was not assessed accurately, the organization seeks to understand why. In reviewing the assessment of severity, the organization challenges the understanding of the business context, the assumptions underpinning the initial assessment and whether new information has become available that may help refine the assessment results. Point C on the figure indicates where an entity has experienced more risk than anticipated for a given level of performance.
Given the results of the monitoring activities, the organization can determine the most appropriate course of action.

لا توجد أفكار عن “Risk Profile Illustrations”
thanks Ibrahim! It was so a syntetic and clear overview of risk profile! Congrats!
I am studying Cia 2, I am a Cisa auditor
marina
التعليقات مغلقة.